Price Trends & Insights
Understand pricing patterns, spot fake discounts with historical data, and make informed purchasing decisions.
30-Day History
We track prices daily across all platforms. Every product page shows a 30-day price history chart so you can see the real trends.
Fake Discount Detector
Some platforms inflate MRP before showing discounts. Our historical data reveals the true pricing pattern so you never fall for it.
Best Time to Buy
Prices fluctuate based on demand, promotions, and supply. Our data helps you identify the best time to purchase your medications.
Top Opportunities (High Price Variance)

medicine
Advent Forte 457mg Syrup Tangy Orange
Platforms Tracked
2
Price DropSAVE 44%
Starting from₹182.41
Compare Prices →
medicine
Amtas 5 Tablet
Platforms Tracked
3
Price DropSAVE 44%
Starting from₹45
Compare Prices →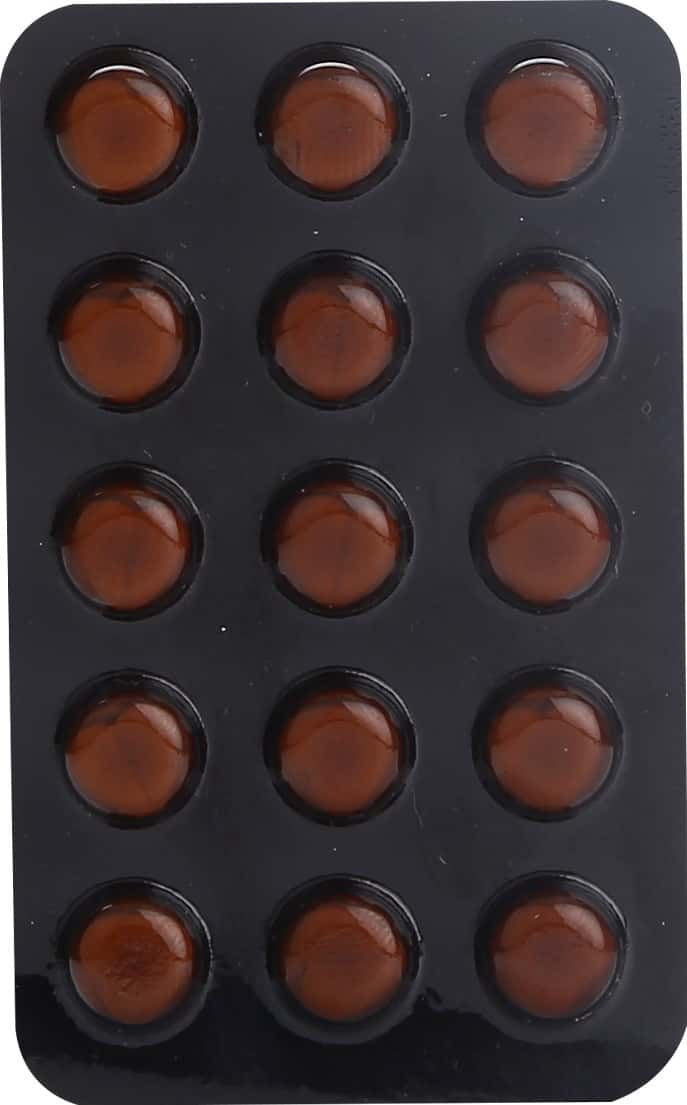
medicine
Asomex 5 Tablet
Platforms Tracked
2
Price DropSAVE 42%
Starting from₹138
Compare Prices →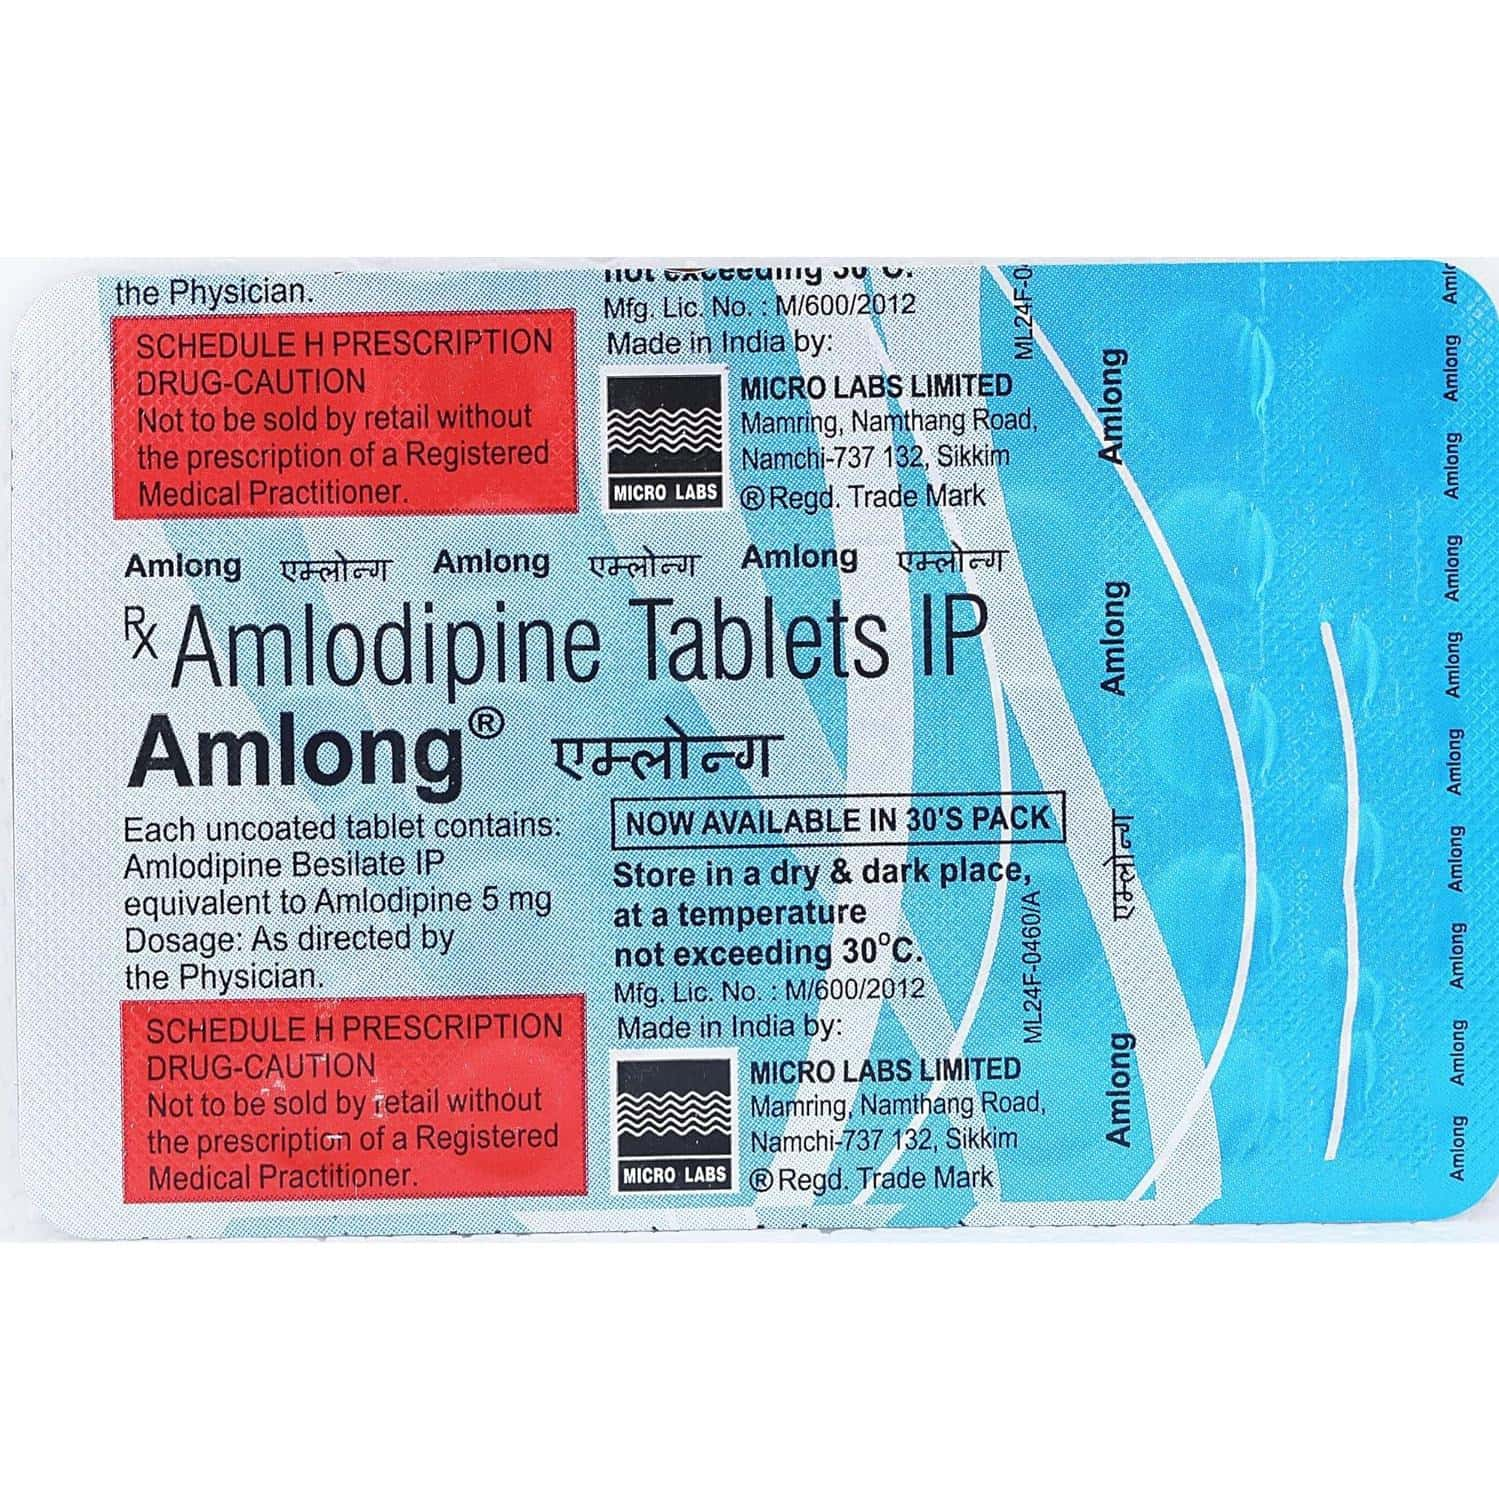
medicine
Amlong Tablet
Platforms Tracked
3
Price DropSAVE 40%
Starting from₹46
Compare Prices →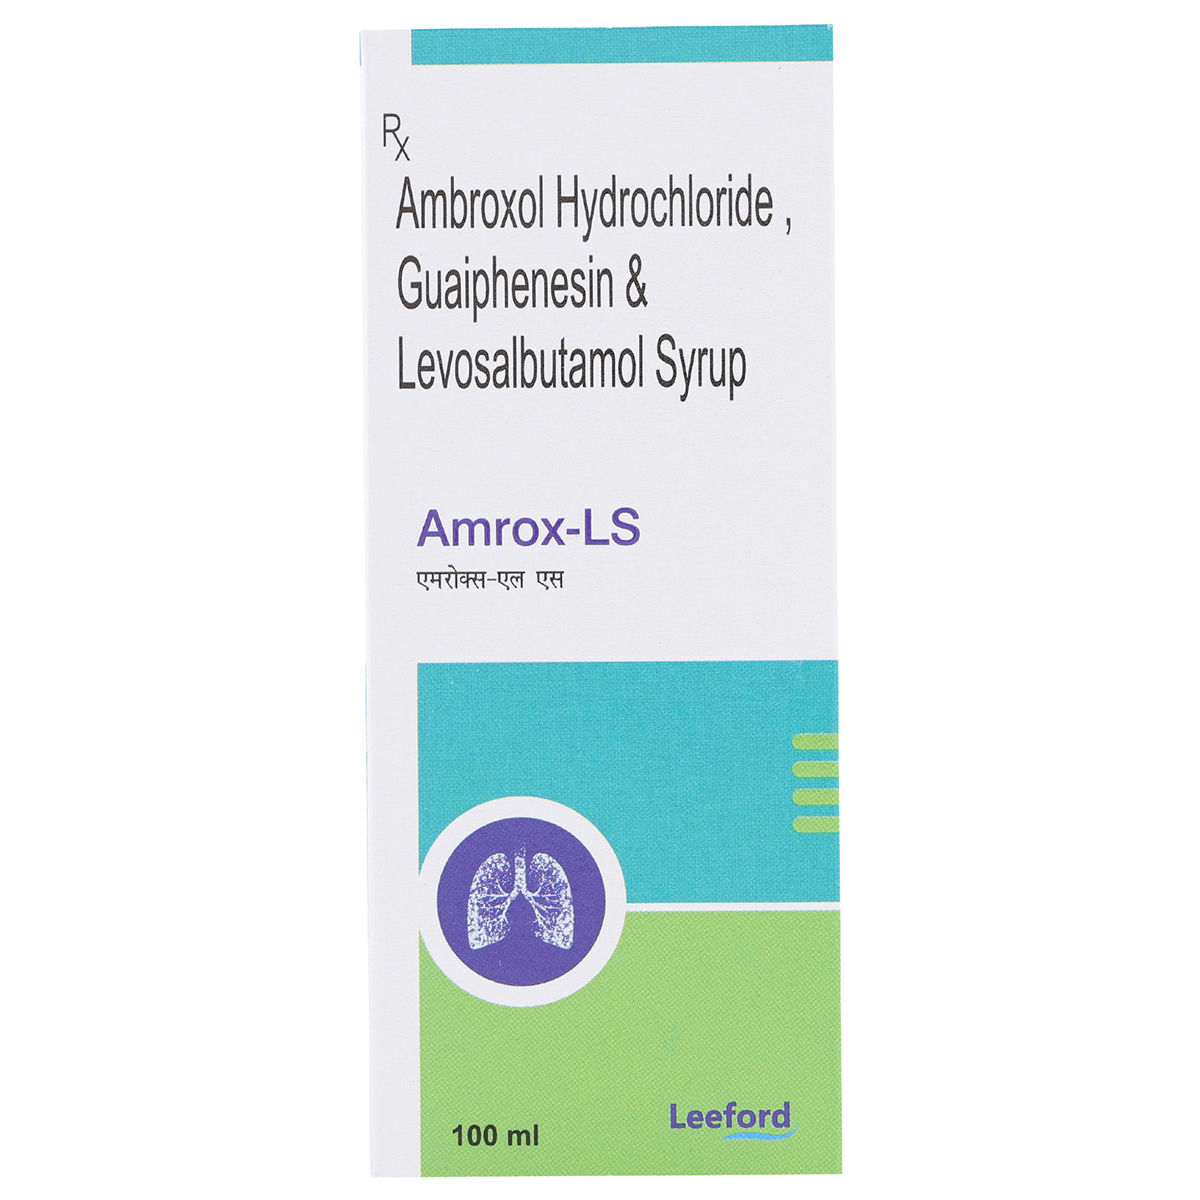
medicine
Amrox-LS Syrup
Platforms Tracked
3
Price DropSAVE 39%
Starting from₹64.96
Compare Prices →
medicine
AB Phylline N Tablet
Platforms Tracked
3
Price DropSAVE 37%
Starting from₹196.08
Compare Prices →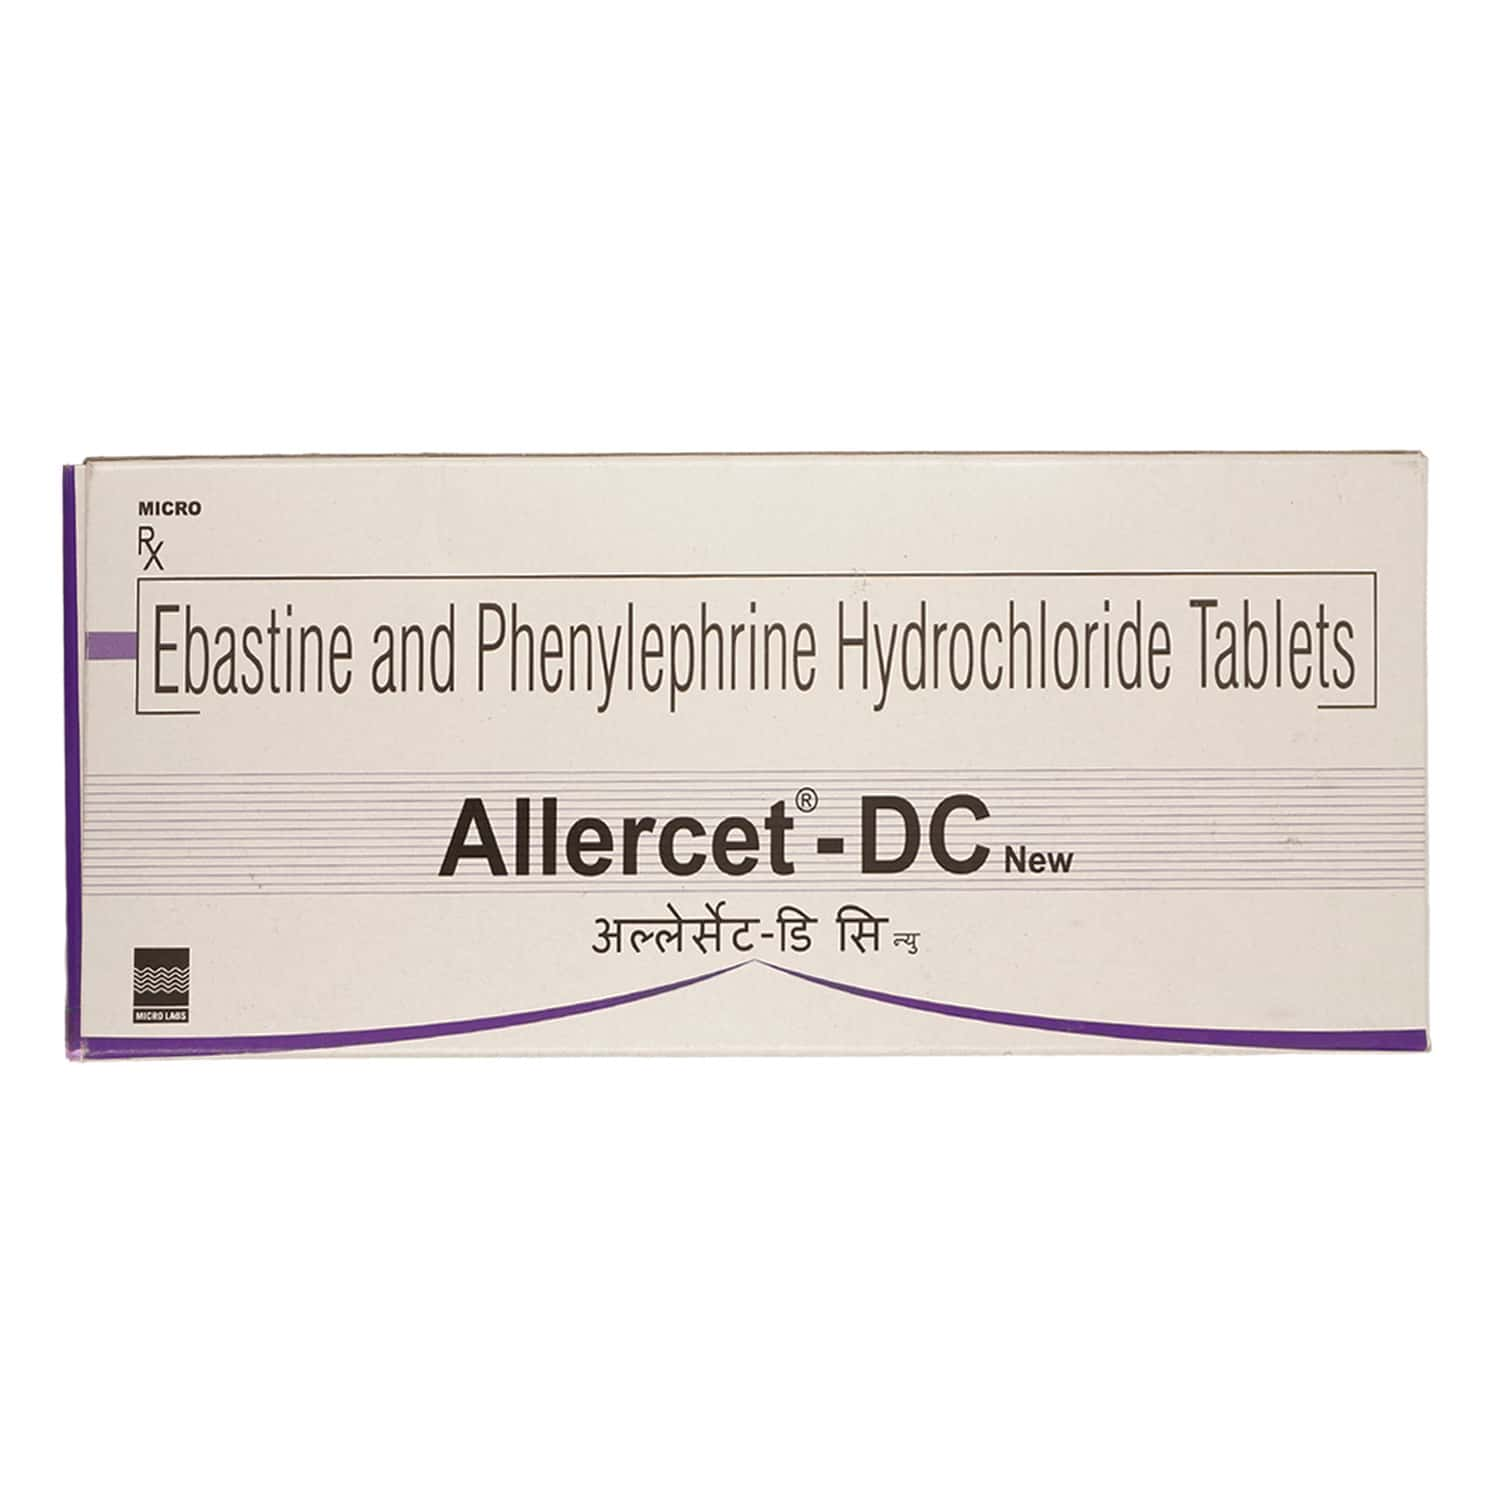
medicine
Allercet-DC Tablet
Platforms Tracked
2
Price DropSAVE 31%
Starting from₹67.5
Compare Prices →
medicine
Atorva 20 Tablet
Platforms Tracked
3
Price DropSAVE 31%
Starting from₹139.75
Compare Prices →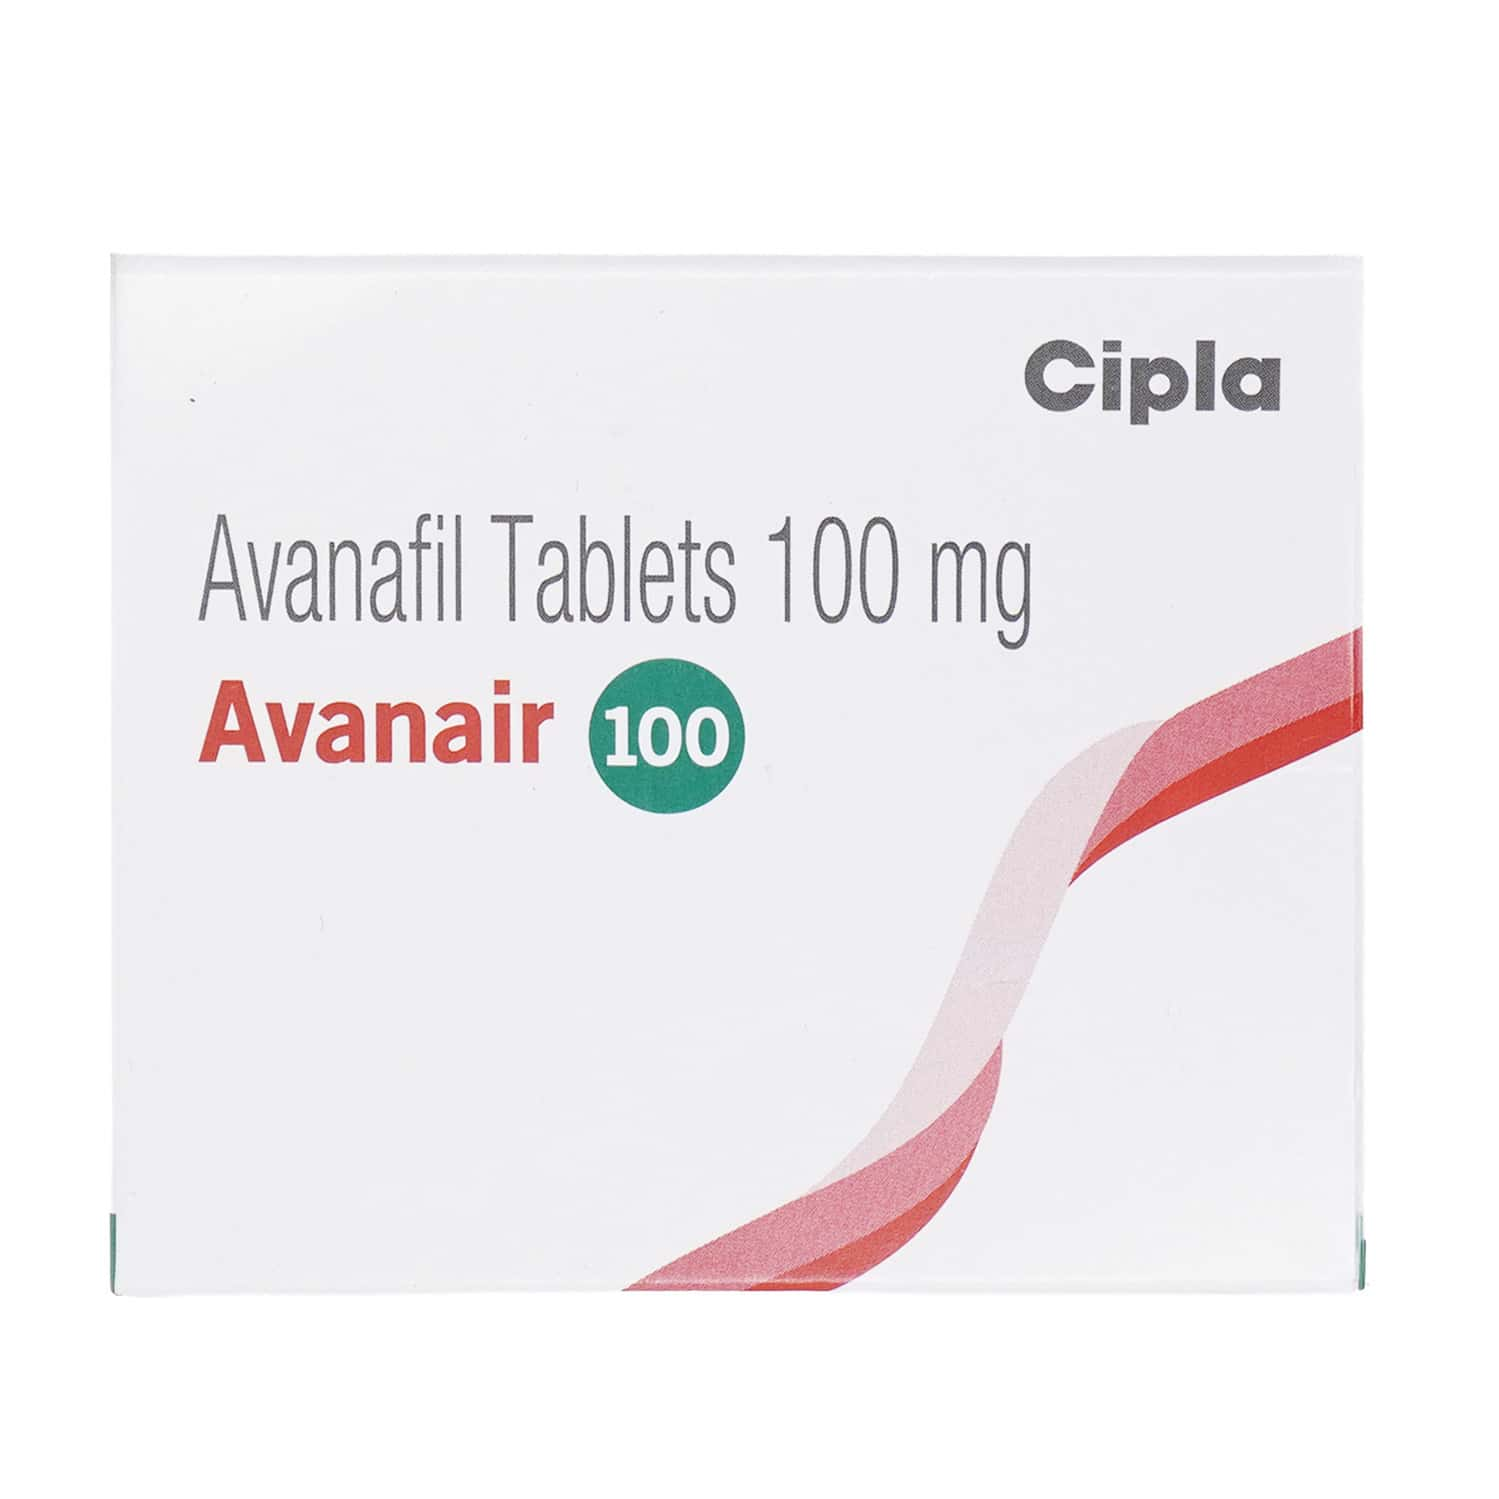
medicine
Avanair 100 Tablet
Platforms Tracked
3
Price DropSAVE 26%
Starting from₹203.14
Compare Prices →
medicine
Actibile 300 Tablet
Platforms Tracked
3
Price DropSAVE 26%
Starting from₹410.89
Compare Prices →
medicine
Atorva 80 Tablet
Platforms Tracked
3
Price DropSAVE 26%
Starting from₹322.86
Compare Prices →
medicine
Azithral 500 Tablet
Platforms Tracked
3
Price DropSAVE 26%
Starting from₹93.79
Compare Prices →How to Read Our Charts
Price Dropping
When you see a downward trend, it means the platform is genuinely reducing prices — possibly due to competition or a sale event. This is a good time to buy.
Price Inflating
An upward trend might indicate a supply shortage or an upcoming "fake discount" where MRP gets inflated. Compare with other platforms before buying.
Start comparing now
Search for any medicine and view its price history chart. It's free, transparent, and always up-to-date.